- 1 User Manual
- 2 Installation and Requirements
- 3 Starting X2K
- 4 Quick Analysis
- 5 Identification of Upstream Transcription Factors and the Transcription Factors Tab
- 6 The Protein-Protein Interaction Network Module and Protein Network Tab
- 7 The Protein Kinase Enrichment Analysis Module and Kinases Tab
- 8 The Drug Prediction Module and the Drugs Tab
- 9 Gene-List Enrichment Analysis Module and the Enrichment Tab
- 10 Running in Batch
- 11 Contact and Support
- 12 References
This user manual is available in PDF format.
The installer for X2K is available for download on the home page. The installer is compatible with Windows, Mac OS X, and Linux. X2K requires that you have at least Java 6 installed. You can get the latest version of Java at: http://www.java.com/getjava.
The installer will install the required files to run X2K, shortcuts to run it, and optionally the source code for X2K.
X2K can be launched in GUI mode or command line mode. To launch it in GUI mode, simply just double click on the downloaded java file. To launch it in command line mode, open a command prompt window and type:
More about command line mode can found in the section about running in batch.
Upon starting up X2K, the program starts with the first tab dedicated for performing a quick analysis with X2K. There are two ways to input gene-lists into X2K: pasting a list of genes or importing a gene list from a file. The gene list should be formatted such that there is one Entrez Gene Symbol on each line with no dashes, spaces or special characters. You can paste gene-lists directly into the input text box for a gene-list column, or by clicking on the Input Gene List button to browse for your gene-list text file as seem below:

By default, the output file will be stored in the same directory where the X2K program resides. On Windows, the output will appear in your User Folder. You may also specify where you would like the output to go by clicking on the Output Summary button as seen below:
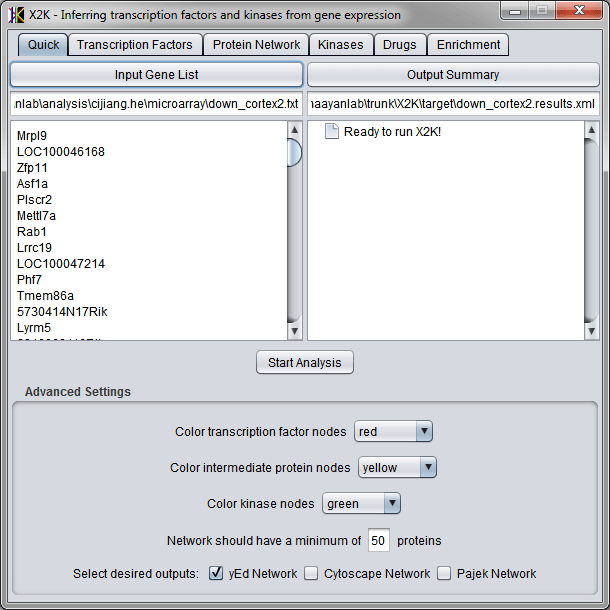
At the bottom of the quick analysis panel there are few advanced settings to help with formatting the output. The color options control the colors for each type of node when it will be displayed in the network visualization output. The settings also allow options for selecting the type of network visualization output files. Three types of files can be created for network visualization with the following network visualization tools: yEd, Cytoscape, or Pajek. The network minimum number ensures that the protein network obtained during the network expansion step finds at least a certain number of proteins. If there are insufficient proteins found in that step, the path length is automatically increased so that there are more intermediates used to connect the transcription factors.
The other tabs in the X2K user interface (UI) also have settings that influence the output. These will be explained in detail below. These settings should also be configured before running the quick option of X2K. Once ready to run, click the Start Analysis button. A progress bar will pop up indicating the different stages of the analysis. This process may take between 30 seconds to two minutes to run depending on your operating and computer systems.

The result of the analysis will be displayed in the right column of each panel. On the quick analysis panel, you will see a summary list of the transcription factors, protein network, and protein kinases that X2K recovered.

The first step of the X2K analysis is transcription factor enrichment analysis. The input gene list that was pasted or loaded into the Quick Analysis screen is also the same input list that this shown in the Transcription Factor tab screen. If you just want to perform the transcription factor enrichment analysis, you can upload or paste a gene list in this tab UI. Each section/tab of X2K can be run as a standalone independent program.

This Transcription Factors module/tab Advanced Settings allows you to select the database from which transcription factors are derived from: Chip-X is from the ChEA database[1] or position weight matrices (PWM) are computed from both JASPAR[2] and TRANSFAC[3]. Furthermore, you can filter the transcription factors organism source by choosing mouse only, human only, or both mouse and human. There are also three enrichment scoring and sorting options available: the Fisher Exact test p-value, the z-score of the transcription factor compared to the background expected rank if the enrichment was applied to random set of genes, or combined score which utilizes both the p-value from the Fisher Test and the z-score to compute a combined score for scoring, sorting and ranking. Finally, the last option allows you to select the number of transcription factors that should carry over to the next step of analysis.
Clicking on the View Results button, after the upstream transcription factors have been identified by X2K, opens a CSV file containing a ranked list of all the transcription factors, their scores, and the genes that they putatively bind to from the input list.
The Protein-Protein Interaction Network Module and Protein Network tab is an updated version of the program Genes2Networks[4]. It can be used to build protein-protein interaction subnetworks given a set of seed proteins/genes as input using background networks of protein-protein interactions from multiple sources. If the quick analysis was utilized, the inputs for the network expansion (the seed genes) at this stage of analysis are the transcription factors found on the right column of the transcription factor tab from the previous screen. This module/tab can also be used as a standalone where you can input your own list of seed genes/proteins by either browsing for a text file as described above or by pasting the lists of genes directly into the text box on the left.

The Advanced Settings of the Protein Network tab/module provide several options for controlling the output subnetworks that can be produced: a) changing the path length increases the number of intermediate proteins used to connect the seed genes. A path length of 2 means that the path between two seed nodes, for example two transcription factors, requires two edges to connect the seeds which means only one intermediate protein between them, i.e., a protein that interacts with both seed nodes. The checkboxes near each protein-protein interaction (PPI) database allows you to select the different PPI databases that you want to be used to draw protein-protein interactions from to do the network expansion. Another way to constrain the results is to limit the number of neighbors a protein can have as it would eliminate hubs to avoid their influence on the results. You can also filter the dataset by limiting the number of interactions that can be contributed by an article. This option can be used to remove interactions from high-throughput experiments. Such interactions may be deemed as containing more false positives. To further ensure the quality of the interactions in outputted subnetworks, you can filter by allowing only interactions that have been reported in a certain minimum number of articles. Finally, if this module is used as a standalone, the option to have the subnetwork visualized is also available. Clicking on the View Results button after the subnetwork was generated by X2K opens a SIG file that contains the interactions that comprise the protein subnetwork. A description of a SIG file can be found at the SBCNY website. Clicking on the View Network button generates a circular visualization of the subnetwork. Note that the visualization option in X2K is very primitive and not recommended. We recommend using either yEd, Cytoscape, or Pajek for network visualization.
The protein kinases module/tab provides the functionality available online by the program KEA[5]. Given a list of proteins as an input the program computes enrichment for protein kinases based on a database of kinase-substrate interactions. If the quick analysis was utilized, the inputs to the kinase enrichment analysis module are the results from the network expansion stage. All the subnetwork nodes are converted to the input list for the kinase enrichment analysis. Otherwise, like with the other standalone modules, a gene list can be pasted into the left column or uploaded as a text file containing a list of genes.
In the advanced settings section, similar to the transcription factors panel, you can choose the different scoring methods and the number of kinases to include in the output. In addition, the output table of kinases can be resolved down to the specific kinase, the kinase family, or the more general kinase class. Clicking on the View Results button after the upstream kinases have been identified by X2K opens a CSV file containing the different kinases, their scores, and the proteins that they phosphorylate.

We utilize the Connectivity Map[6] to rank drugs that can either reverse or aggravate gene expression given an input list of up or down differentially expressed genes. From the Connectivity Map, we extracted the list of 500 genes that were either induced or decreased in expression after the drug treatment in a specific experiment from the Connectivity Map dataset. The output from such analysis is a ranked list of drugs that are potentially regulators of the genes from the input list of differentially expressed genes, or the upstream pathway inferred by X2K.
Once an X2K analysis is done using the quick option, the network consisting of the transcription factors, intermediate proteins, and kinases are used as the input to the Drugs Prediction Module. Otherwise, you can cut and paste or upload any list of genes for drug prediction analysis. The Fisher exact test is used to rank drugs.

The result on the right column after clicking the Find Drugs button gives the top n drugs from Connectivity Map ordered by the number of genes that they match minus the number of genes that they conflict with. By clicking on the View Results button, you can view an XML file containing the ordered list of top drugs with the genes that they matched and conflicted with. The four digit number next to each drug provides a reference to the Connectivity Map experiment.
Many X2K components provide gene-list enrichment analyses by comparing an input list of genes/protein to a background library of tagged gene-lists. The Gene-List Enrichment Analysis Module and the Enrichment tab provides such analysis for many additional gene-list libraries, many of the same libraries available within the program Lists2Networks[7]. In fact, 14 different libraries for different biological categories are currently provided.
By clicking on the Input Genes button, you can import a gene list file, or alternatively a list can be pasted into the text area on the left. The Advanced Settings provides the ability to exclude or include gene-list libraries of different categories. After running the enrichment analysis, a tree list shows the enriched terms under each gene-list library category. Clicking on the View Results button brings up an XML file that summarizes the top enriched terms for each category. In addition, within the same directory, full results for each enrichment category are provided as CSV files where each term, its resulted p-values, and the matched genes with the input genes are enlisted.

To launch X2K in command line mode, open a command prompt window and type:
Because there is no UI or switches in the command line version of X2K, all configurations to the program are done via the settings file named settings.ini located in the same directory as the X2K binary. Below is a sample settings file:
#String: rank the TFs by the Fisher Exact test's p-value, rank against the background of random genes, or combined score of the two. [combined_score/pvalue/rank]
#sort_TFs_by: combined_score
#String: the organisms included in the transcription factor background database for enrichment analysis. [mouse_only/human_only/both]
#included_organisms: both
#String: the source of the transcription factor background database used for enrichment analysis. [ChIP-X/PWM]
#background_database: ChIP-X
#Network Settings
#Integer: the starting path length (number of edges between nodes) to do network expansion. [>=2]
#path_length: 2
#Integer: limit the maximum number of interactions that a particular protein has to exclude hub proteins. 0 means disabled. [>0]
#max_number_of_interactions_per_protein: 0
#Integer: limit the maximum number of interactions that a particular article contributes to exclude high-thoroughput studies. 0 means disabled. [>0]
#max_number_of_interactions_per_article: 0
#Integer: require a minimum number of articles to report a specific interaction to strengthen the validity of the interaction. 0 means disabled. [>0]
#min_number_of_articles_supporting_interaction: 0
#Boolean: enable BIND database. [true/false]
#enable_BIND: true
#Boolean: enable Biocarta database. [true/false]
#enable_Biocarta: true
#Boolean: enable BioGRID database. [true/false]
#enable_BioGRID: true
#Boolean: enable DIP database. [true/false]
#enable_DIP: true
#Boolean: enable figeys database. [true/false]
#enable_figeys: false
#Boolean: enable HPRD database. [true/false]
#enable_HPRD: true
#Boolean: enable InnateDB database. [true/false]
#enable_InnateDB: true
#Boolean: enable IntAct database. [true/false]
#enable_IntAct: true
#Boolean: enable KEA database. [true/false]
#enable_KEA: false
#Boolean: enable KEGG database. [true/false]
#enable_KEGG: true
#Boolean: enable MINT database. [true/false]
#enable_MINT: true
#Boolean: enable MIPS database. [true/false]
#enable_MIPS: true
#Boolean: enable murphy database. [true/false]
#enable_murphy: false
#Boolean: enable pdzbase database. [true/false]
#enable_pdzbase: true
#Boolean: enable ppid database. [true/false]
#enable_ppid: true
#Boolean: enable SNAVI database. [true/false]
#enable_SNAVI: true
#Boolean: enable Stelzl database. [true/false]
#enable_Stelzl: false
#Boolean: enable vidal database. [true/false]
#enable_vidal: false
#Boolean: output a yEd graphml file for network visualization of the expansion. [true/false]
#enable_expansion_yEd_output: true
#Boolean: output a Cytoscape XGMML file for network visualization of the expansion. [true/false]
#enable_expansion_Cytoscape_output: false
#Boolean: output a Pajek NET file for network visualization of the expansion. [true/false]
#enable_expansion_Pajek_output: false
#String: web color of the seed genes in the Cytoscape and yEd network expansion outputs. [#000000 - #FFFFFF]
#seed_node_color: #FF0000
#String: web color of the expanded protein network in the Cytoscape and yEd network expansions outputs. [#000000 - #FFFFFF]
#expanded_node_color: #00FF00
#Kinase Settings
#String: rank the kinases by the Fisher Exact test's p-value, rank against the background of random genes, or combined score of the two. [combined_score/pvalue/rank]
#sort_kinases_by: combined_score
#String: level of kinase resolution. [kinase-group/kinase-family/kinase]
#resolution_level: kinase
#Enrichment Settings
#Boolean: enable enrichment using BioCarta pathways. [true/false]
#enrich using BioCarta: true
#Boolean: enable enrichment using chromosome location. [true/false]
#enrich using chromosome location: true
#Boolean: enable enrichment using GeneSigDB. [true/false]
#enrich using GeneSigDB: true
#Boolean: enable enrichment using Gene Ontology's biological process namespace. [true/false]
#enrich using GO biological process: true
#Boolean: enable enrichment using Gene Ontology's cellular component namespace. [true/false]
#enrich using GO cellular component: true
#Boolean: enable enrichment using Gene Ontology's molecular function namespace. [true/false]
#enrich using GO molecular function: true
#Boolean: enable enrichment using HMDB metabolites. [true/false]
#enrich using HMDB metabolites: true
#Boolean: enable enrichment using KEGG pathways. [true/false]
#enrich using KEGG: true
#Boolean: enable enrichment using the top 4 terms from Mouse Genome Informatics' Mammalian Phenotype. [true/false]
#enrich using MGI Mammalian Phenotype: true
#Boolean: enable enrichment using microRNA. [true/false]
#enrich using microRNA: true
#Boolean: enable enrichment using OMIM disease genes. [true/false]
#enrich using OMIM disease genes: true
#Boolean: enable enrichment using Pfam InterPro domains. [true/false]
#enrich using Pfam InterPro domains: true
#Boolean: enable enrichment using Reactome pathways. [true/false]
#enrich using Reactome: true
#Boolean: enable enrichment using WikiPathways pathways. [true/false]
#enrich using WikiPathways: true
#Drug Discovery Settings
#Boolean: the input genes are up-regulated. [true/false]
#genes_are_upregulated: true
#Boolean: the drugs reverse the gene's effects; otherwise, it aggravates/exaggerates the effect. [true/false]
#drugs_reverse_effect: true
#Integer: the number of top drugs to return. May still be less if there aren't enough results. [>0]
#number_of_top_drugs: 10
#X2K Settings
#Integer: minimum network size; otherwise, the path length is increased until the minimum met. [>0]
#minimum_network_size: 50
#Integer: number of transcription factors used in network expansion and drug discovery. [>0]
#number_of_top_TFs: 10
#Integer: number of kinases used in drug discovery. [>0]
#number_of_top_kinases: 10
#Boolean: output a yEd graphml file for network visualization. [true/false]
#enable_yEd_output: true
#Boolean: output a Cytoscape XGMML file for network visualization. [true/false]
#enable_Cytoscape_output: false
#Boolean: output a Pajek NET file for network visualization. [true/false]
#enable_Pajek_output: false
#String: web color of the transcription factors in the Cytoscape and yEd network outputs. [#000000 - #FFFFFF]
#TF_node_color: #FF0000
#String: web color of the kinases in the Cytoscape and yEd network outputs. [#000000 - #FFFFFF]
#kinase_node_color: #00FF00
#String: web color of the substrates in the Cytoscape and yEd network outputs. [#000000 - #FFFFFF]
#substrate_node_color: #FFFF00
To enable an option, simple uncomment the line by removing the # before the line. The text before the colon describes the settings and the keyword after the colon describes the state of the setting. For example, to select TRANSFAC as the TF-target gene background database, simply change the settings file to have:
background: TRANSFAC
All comments, suggestions, and request for support should be addressed to avi.maayan@mssm.edu.
[2]Portales-Casamar E, Thongjuea S, Kwon AT, Arenillas D, Zhao X, Valen E, Yusuf D, Lenhard B, Wasserman WW, Sandelin A: JASPAR 2010: the greatly expanded open-access database of transcription factor binding profiles. Nucleic Acids Research 2010, 38(suppl 1):D105-D110.
[3]Wingender E, Chen X, Hehl R, Karas H, Liebich I, Matys V, Meinhardt T, Pru M, Reuter I, Schacherer F: TRANSFAC: an integrated system for gene expression regulation. Nucl Acids Res 2000, 28(1):316-319.
[4]Berger S, Posner J, Ma'ayan A: Genes2Networks: connecting lists of gene symbols using mammalian protein interactions databases. BMC Bioinformatics 2007, 8(1):372.
[5]Lachmann A, Ma'ayan A: KEA: kinase enrichment analysis. Bioinformatics 2009, 25(5):684-686.
[6]Lamb J, Crawford ED, Peck D, Modell JW, Blat IC, Wrobel MJ, Lerner J, Brunet J-P, Subramanian A, Ross KN et al: The Connectivity Map: Using Gene-Expression Signatures to Connect Small Molecules, Genes, and Disease. Science 2006, 313(5795):1929-1935.
[7]Lachmann A, Ma'ayan A: Lists2Networks: Integrated analysis of gene/protein lists. BMC Bioinformatics 2010, 11(1):87.